Lab 2.1: Configure AVR Profiles
An Analytics profile is a set of definitions that determines the circumstances under which the system gathers, logs, notifies, and graphically displays information regarding traffic to an application or service. The Analytics module requires that you select an Analytics profile for each application you want to monitor. You associate the Analytics profile with one or more virtual servers used by the application / service.
- In the Analytics profile, you customize:
- What statistics to collect
- Where to collect data (locally, remotely, or both)
- Whether to capture the traffic itself
- Whether to send notifications.
Task 1 - Import the Postman Collection & Environment
In this task you will Import a Postman Collection & Environment for this lab. Perform the following steps to complete this task:
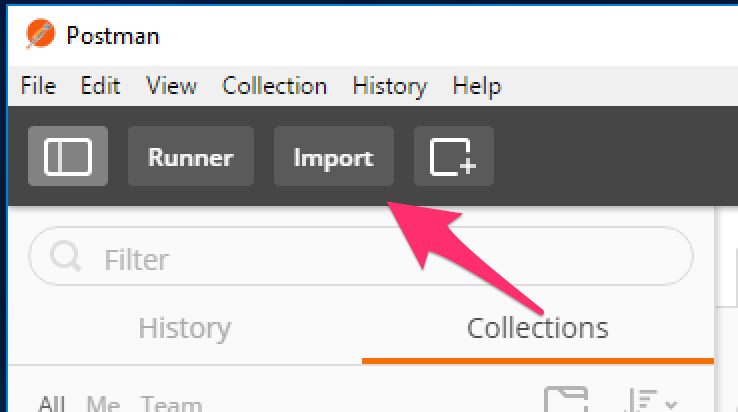
- Open the Postman tool by clicking the
 icon of the desktop of
your Linux Jumphost (Postman should be open from previous Lab)
icon of the desktop of
your Linux Jumphost (Postman should be open from previous Lab) - Click the ‘Import’ button in the top left of the Postman window
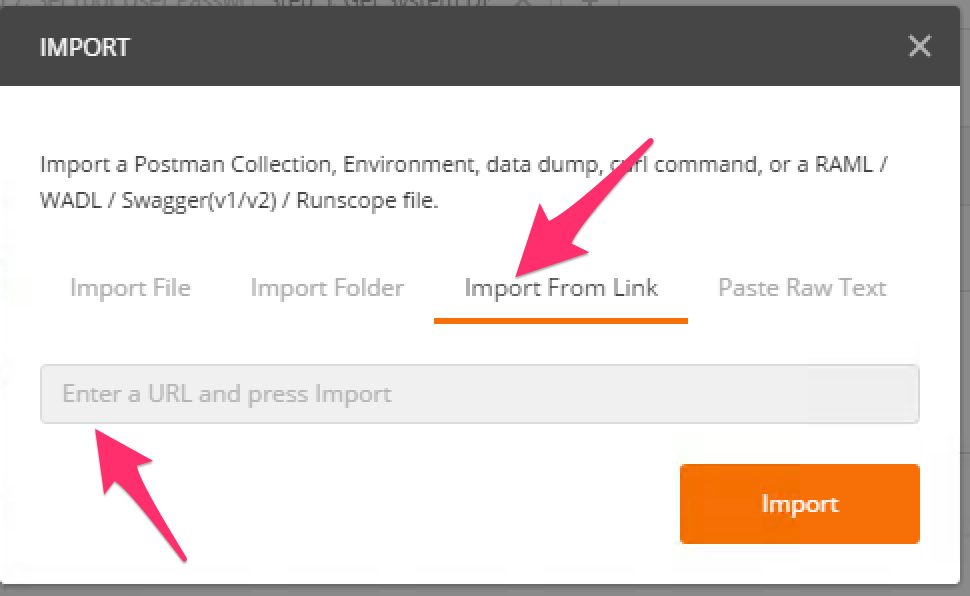
Click the ‘Import from Link’ tab. Paste the following URL into the text box and click ‘Import’
https://raw.githubusercontent.com/jarrodlucia/bigip_elk_server/develop/postman_collections/SP Modules.postman_collection.json
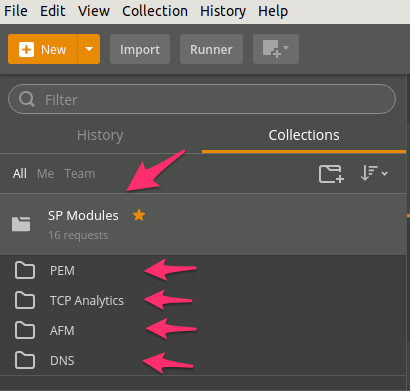
You should now see a collection named ‘SP Modules’ in your Postman Collections sidebar:
Import the Environment file by clicking ‘Import’ -> ‘Import from Link’ and pasting the following URL and clicking ‘Import’:
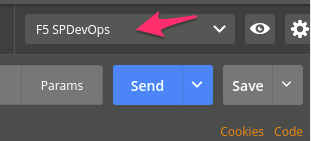
https://raw.githubusercontent.com/jarrodlucia/bigip_elk_server/develop/postman_collections/F5 SPDevOps.postman_environment.json
Task 2 – Configure TCP Analytics
In this task we will query and configure TCP AVR profile. This will be done using REST API (explored in previous Lab)
Perform the following steps to complete this task:
Click the ‘TCP Analytics’ item in the SP Module Postman Collection
Notice that we are sending a GET request to the
/mgmt/tm/ltm/profile/tcp-analyticsendpoint. Check the body returned and observer the default values.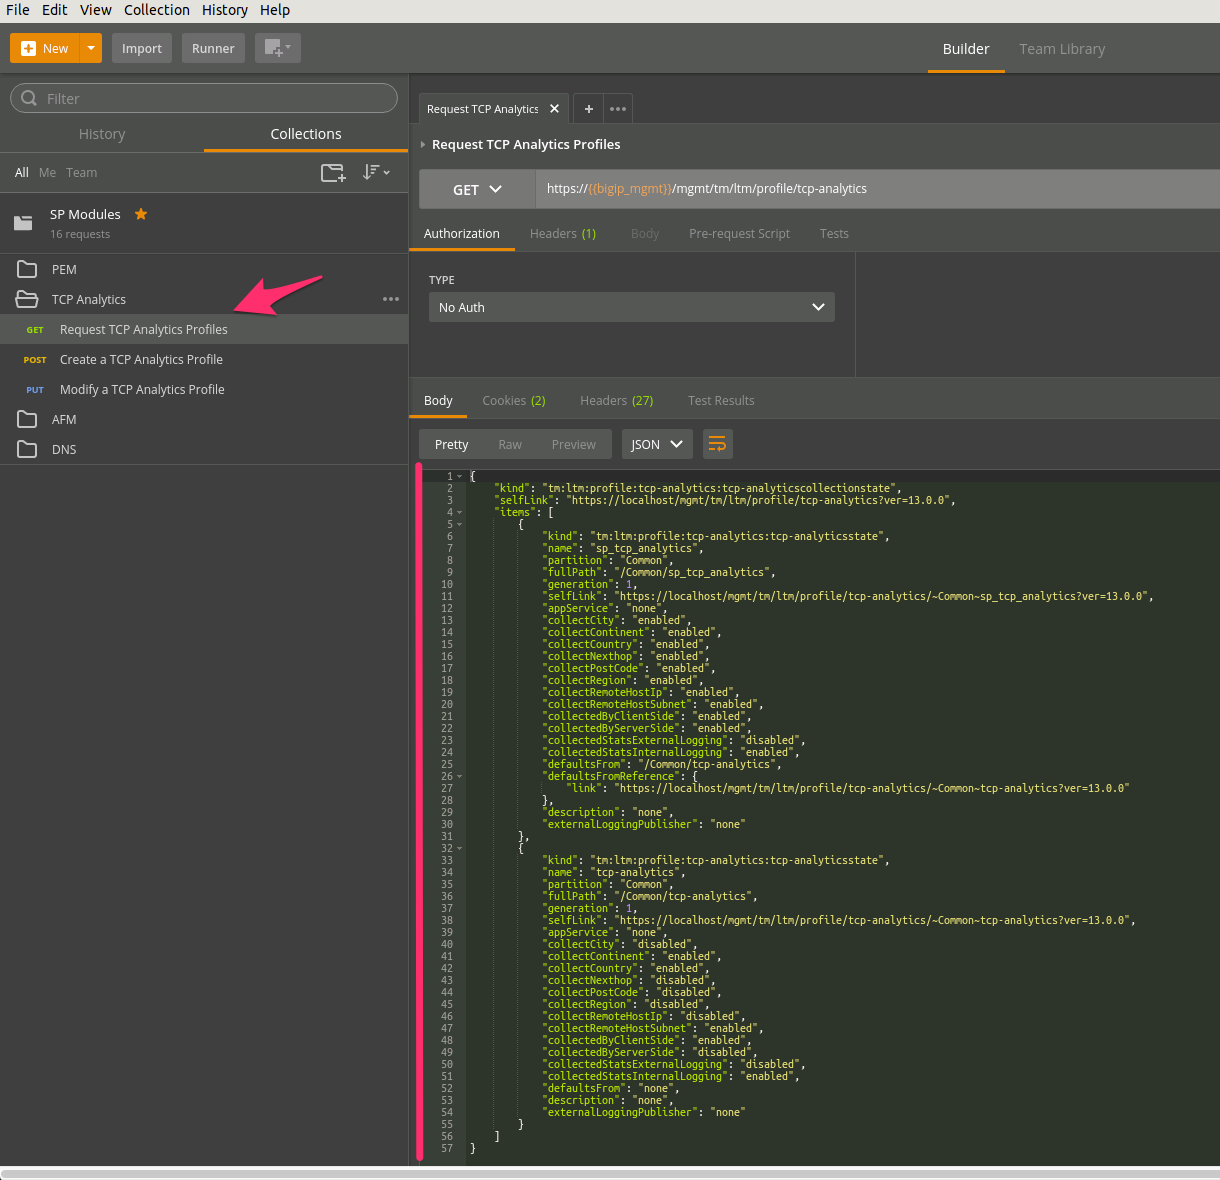
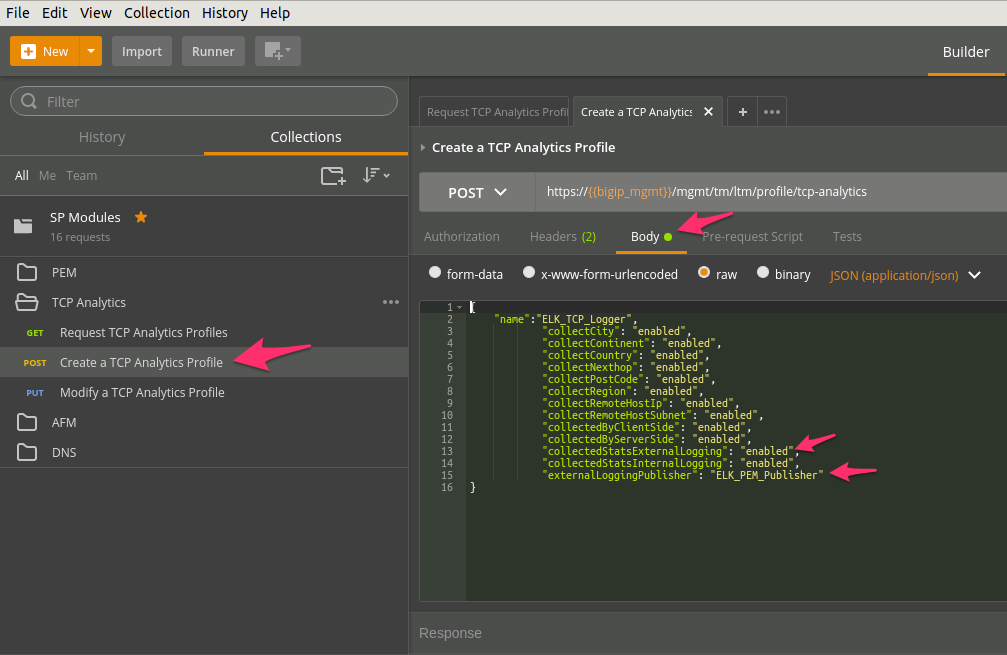
Click on the ‘Create TCP Analytics Profile’ , check the body message for ELK_PEM_Publisher (We will use the PEM index in ELK for logging TCP Optimisation)
Verify in BIG-IP TMUI that the new profile was created.
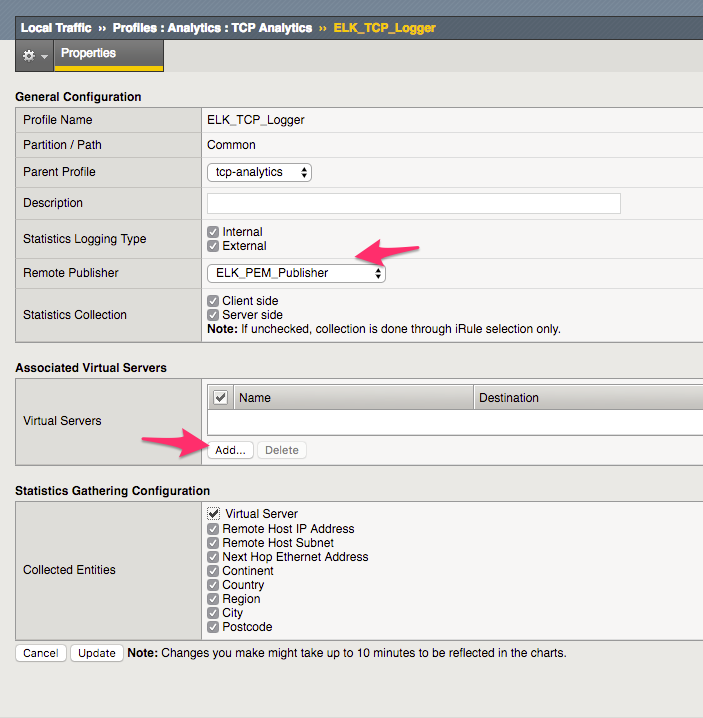
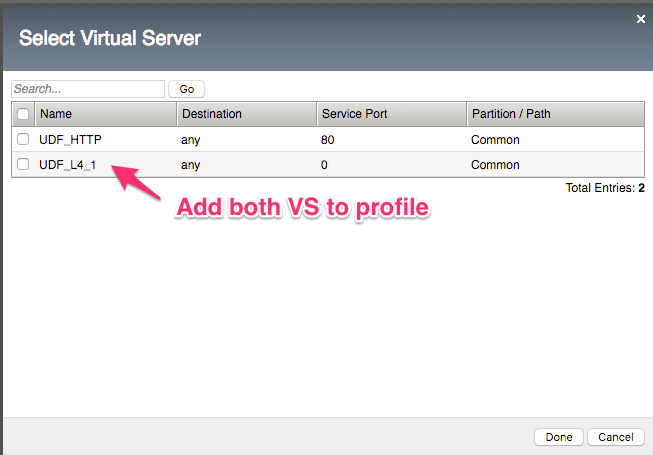
Add in the VS manually (This is not available in REST API currently)
Task 3 – Configure PEM Analytics
In this task we will query and configure PEM AVR profile. This will be done using REST API (explored in previous Lab)
Perform the following steps to complete this task:
Click the ‘PEM’ item in the SP Module Postman Collection
Notice there are two sections we must update Global and Classification. We will do Global first, click on ‘Request PEM Global Analytics Options’ we are sending a GET request to the
/mgmt/tm/pem/global-settings/analyticsendpoint. Check the body returned and observer the default values.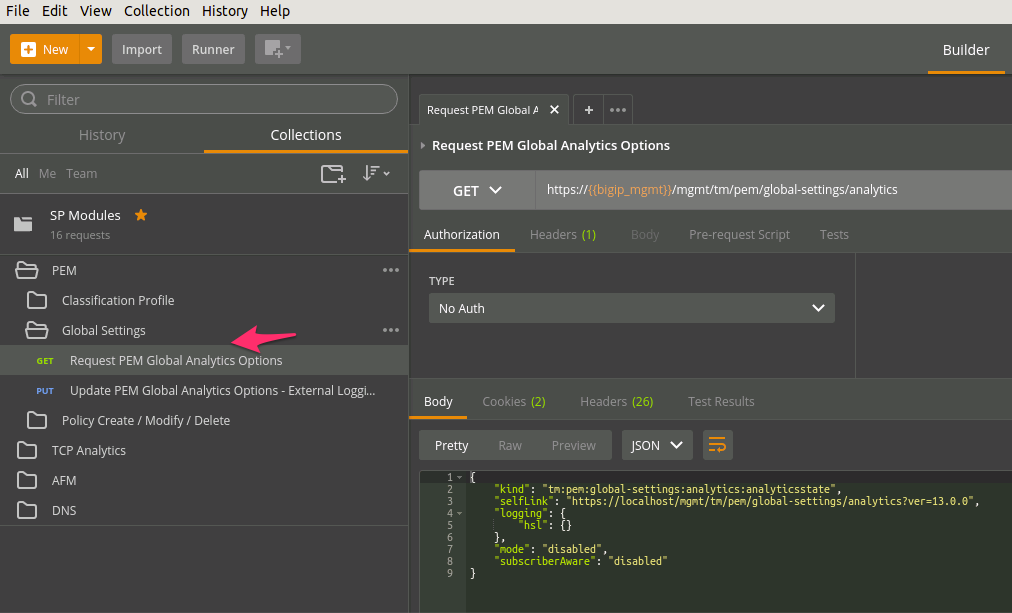
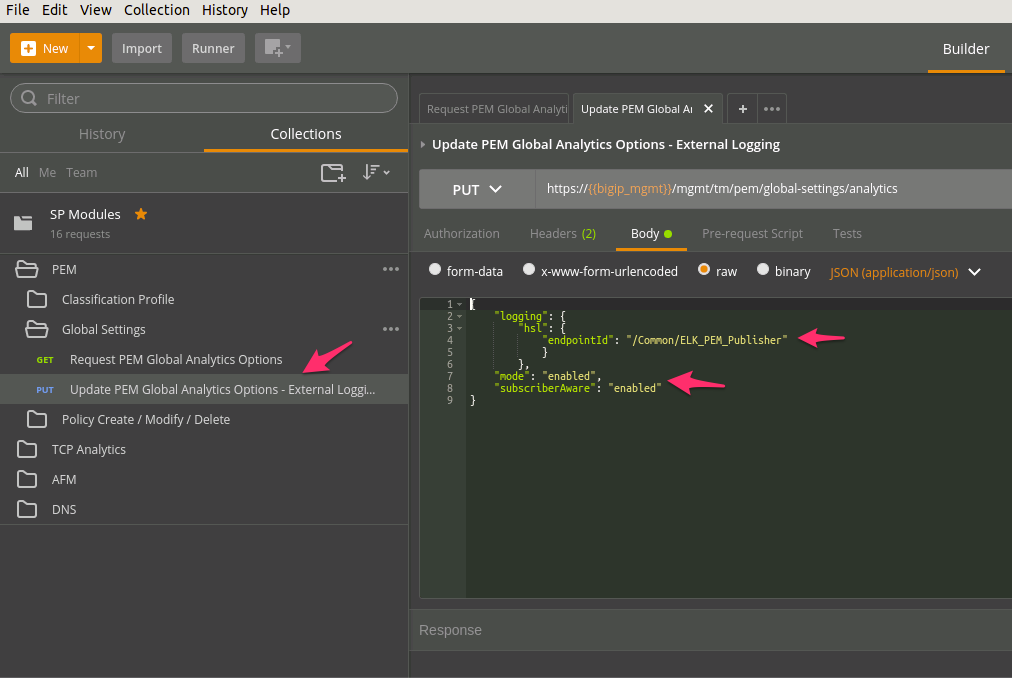
Click on the ‘Update PEM Global Analytics Options - External Logging’ , check the body message for ELK_PEM_Publisher.
Verify in BIG-IP TMUI that the new updates where changed in PEM global options.
Click on ‘Request PEM Classification Profile’ we are sending a GET request to the
/mgmt/tm/ltm/profile/classification/classification_pemendpoint. Check the body returned and observer the default values.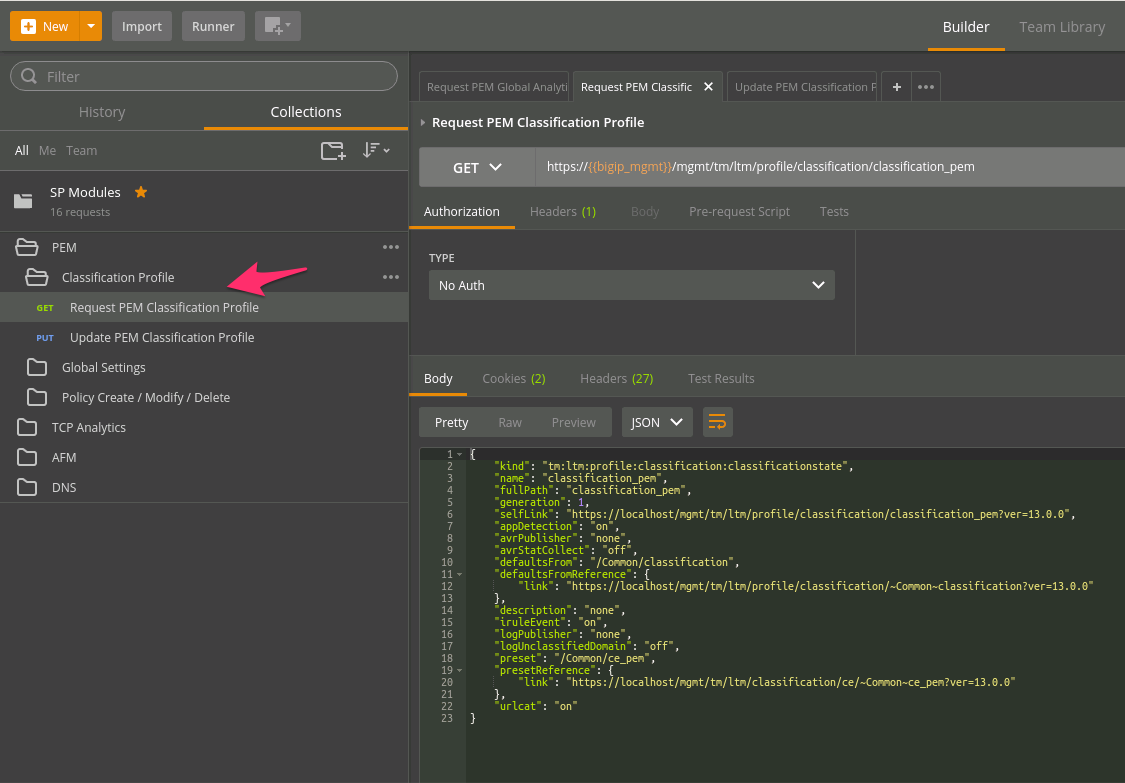
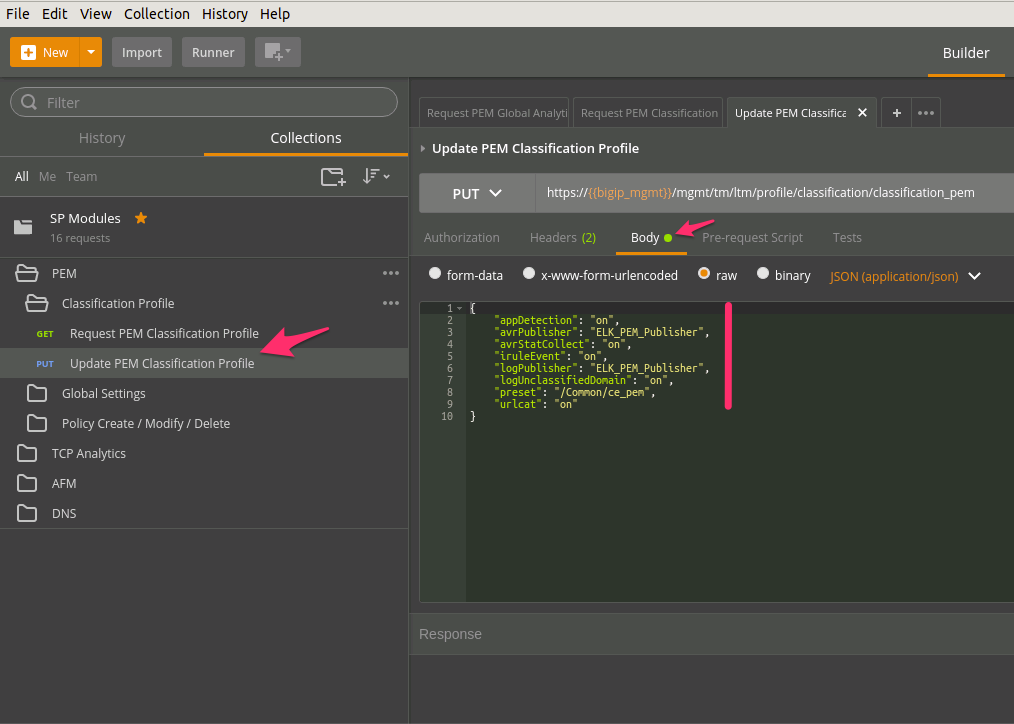
Click on the ‘Update PEM Classification Profile’ , check the body message for ELK_PEM_Publisher.
Verify in BIG-IP TMUI that the new updates where changed in PEM Classification.
Task 4 – Configure AFM Analytics
In this task we will query and configure AFM AVR profile and Logging. This will be done using REST API (explored in previous Lab)
Perform the following steps to complete this task:
Click the ‘AFM’ item in the SP Module Postman Collection
Notice there are two sections we must update Security Reporting and Event Logging. We will do Security Reporting first, click on ‘Request AFM Security Reporting Settings’ we are sending a GET request to the
/mgmt/tm/security/analytics/settingsendpoint. Check the body returned and observer the default values.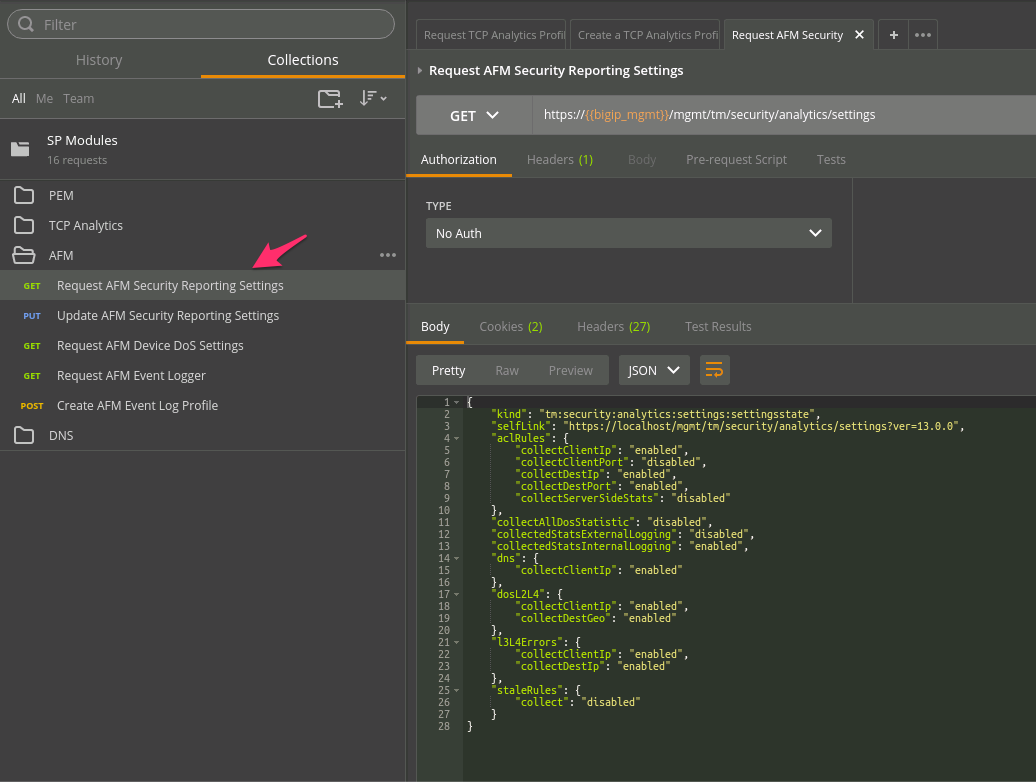
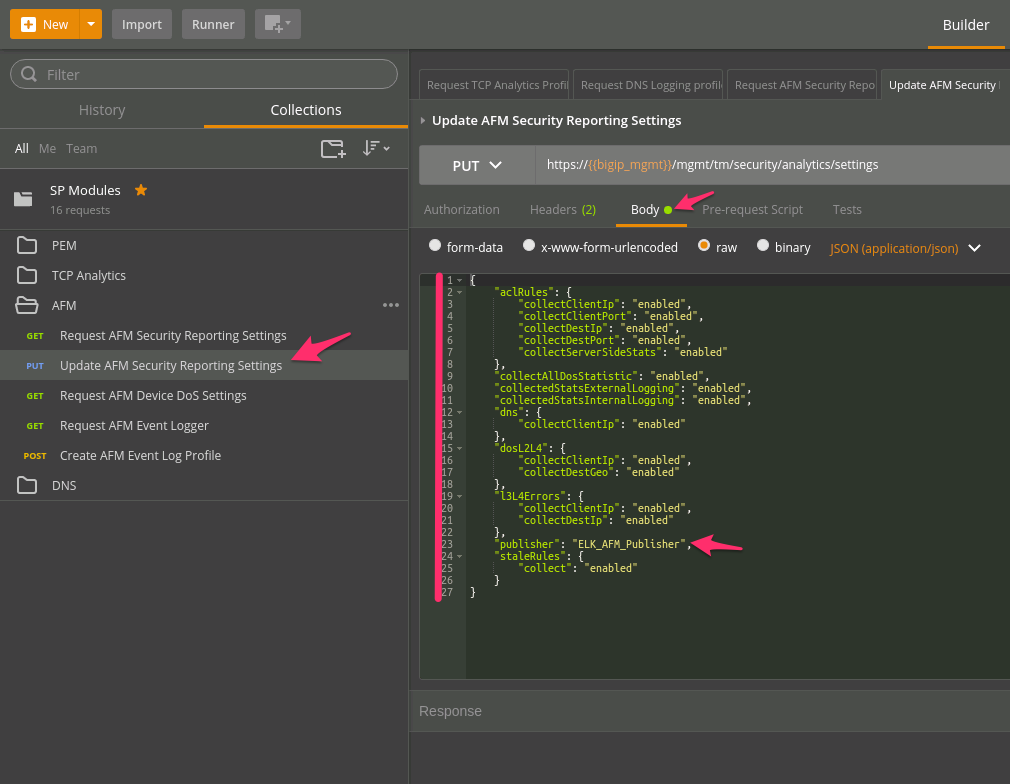
Click on the ‘Update AFM Security Reporting Settings’ , check the body message for ELK_AFM_Publisher.
Verify in BIG-IP TMUI that the new updates where changed in AFM Report Settings.
Note
Request AFM Device DoS Settings - Can be used to report on settings currently set, however REST API cannot be used to update these settings at this time.
Click on ‘Request AFM Event Logger’ we are sending a GET request to the
/mgmt/tm/security/log/profile/endpoint. Check the body returned and observer the default values.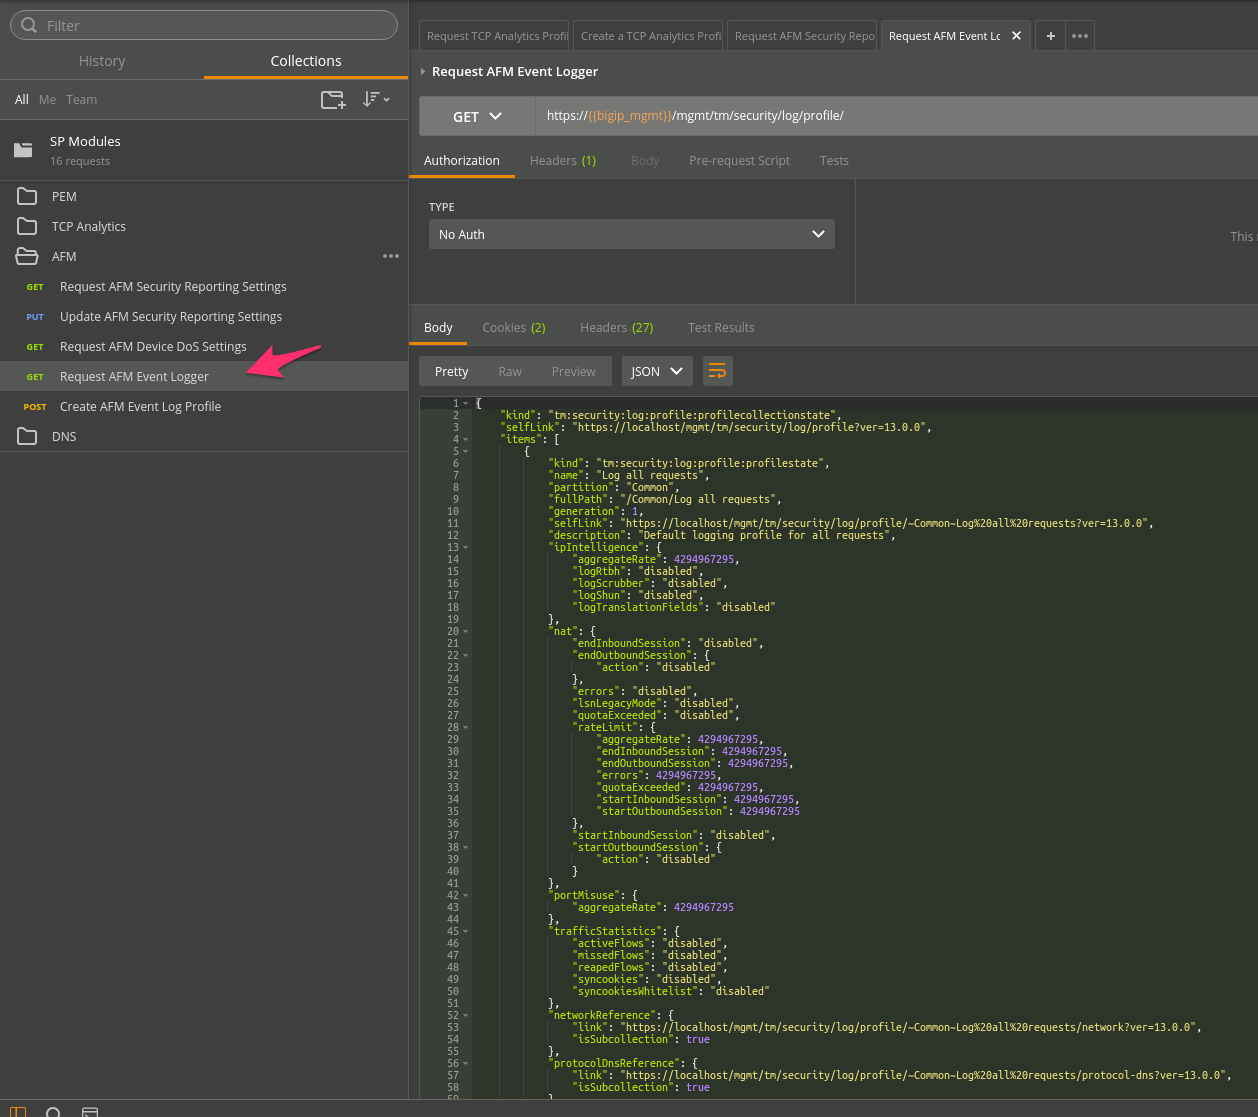
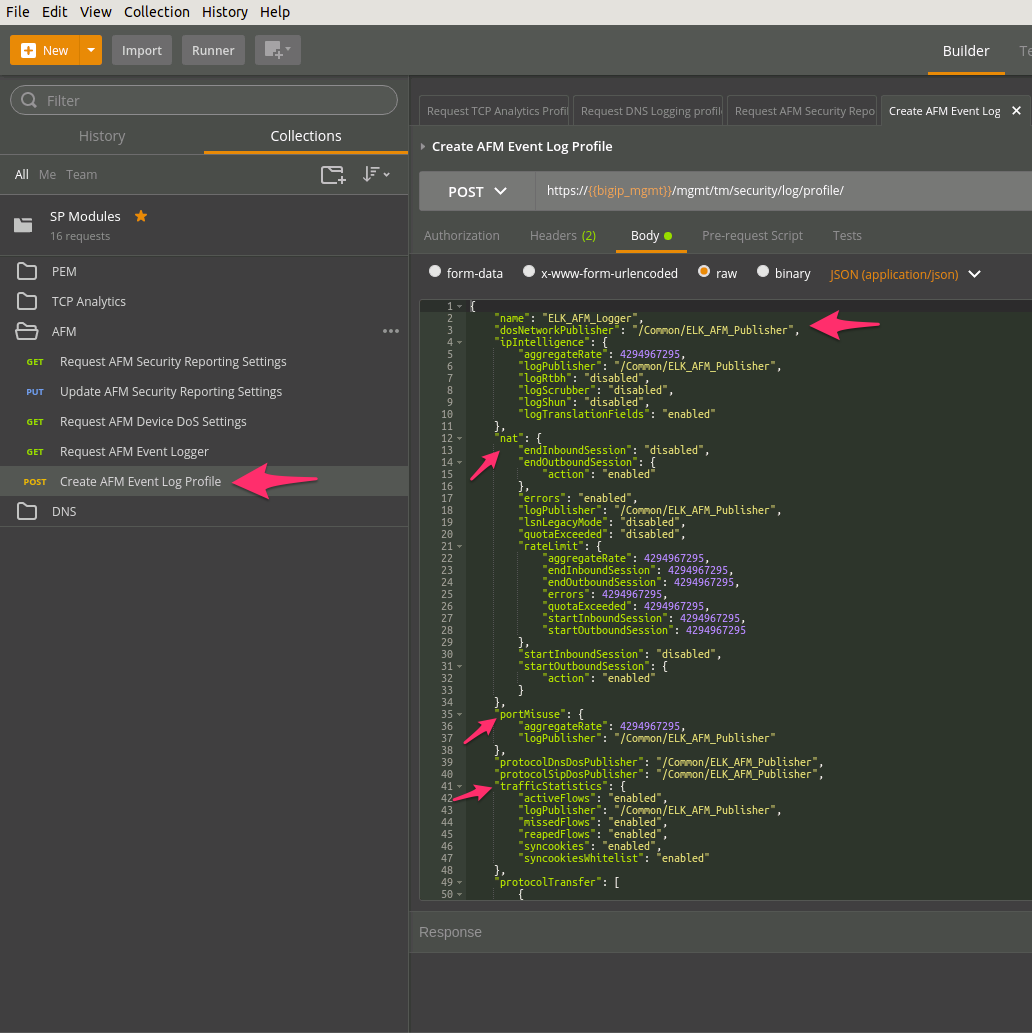
Click on the ‘Create AFM Event Log Profile’ , check the body message for ELK_AFM_Publisher.
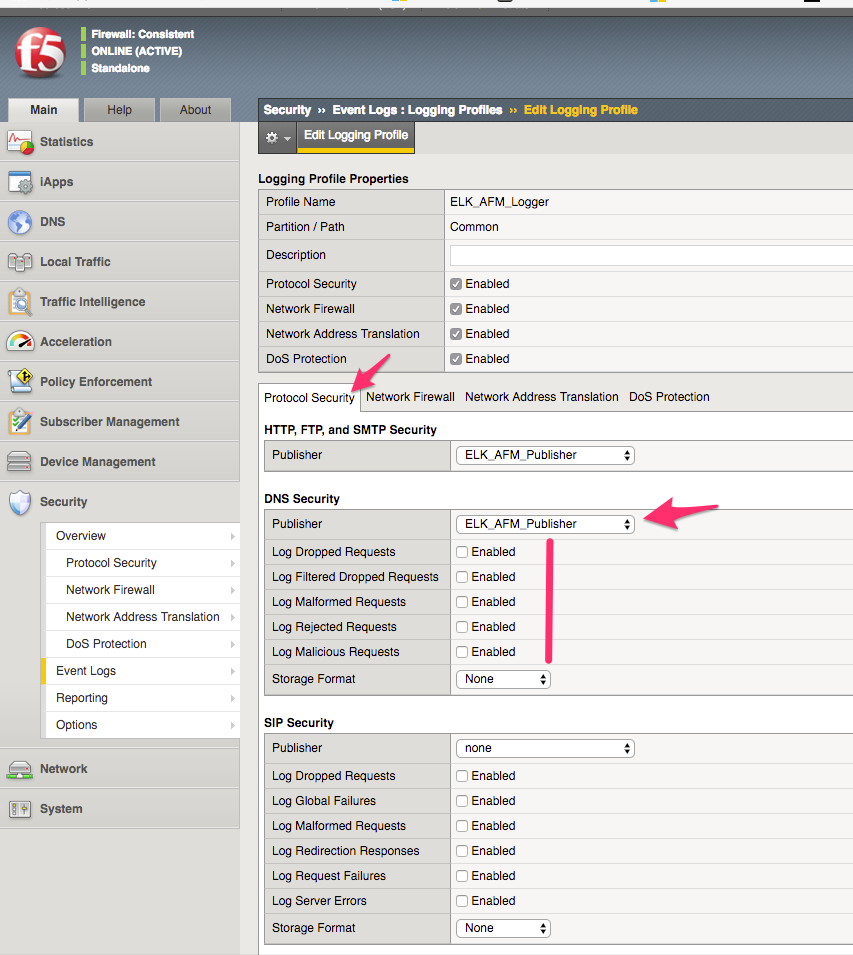
Addtional Steps are required for AFM as not all REST commands can configure all sections at this time. Go to TMUI on BIG-IP and navigate to Security / Event Logs / Logging Profiles. Change Publishers and tick events to log.
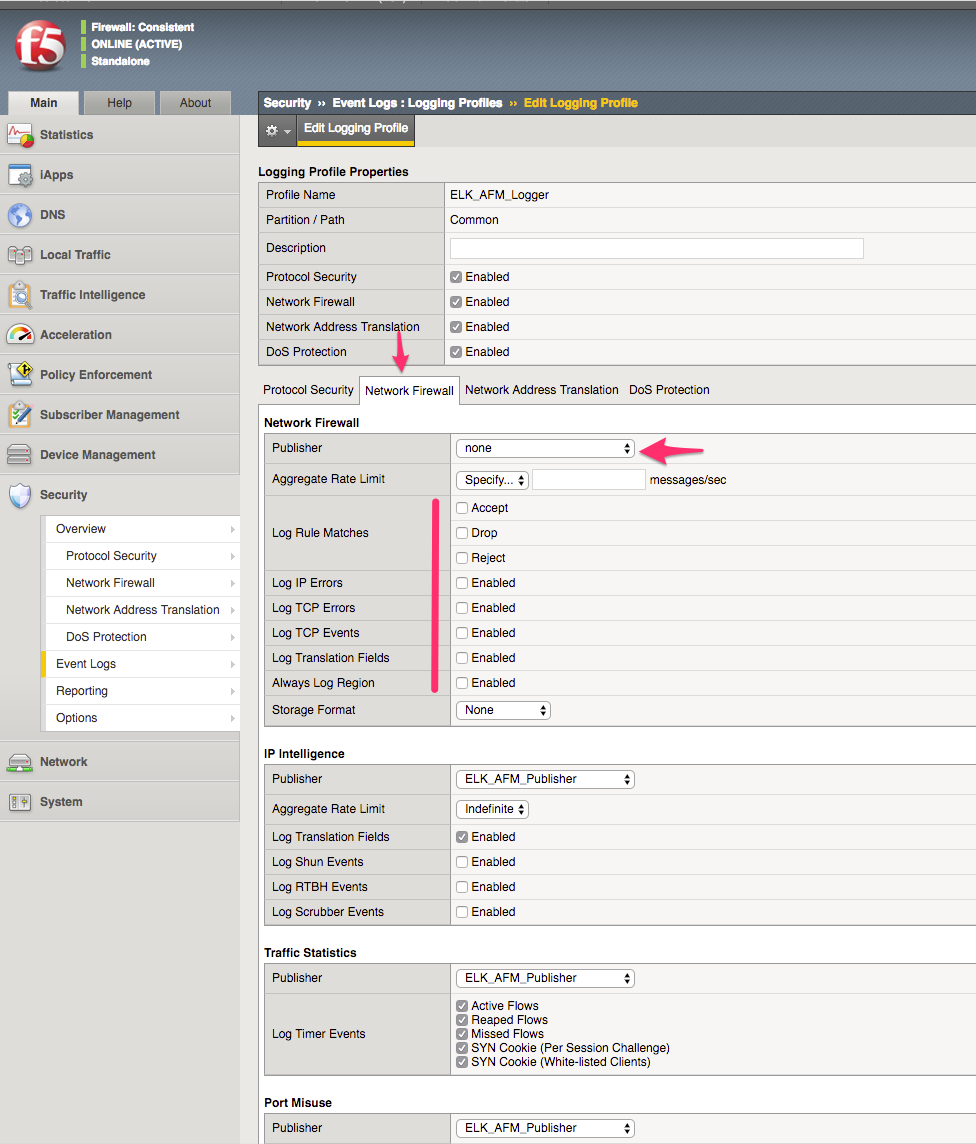
Update Network Firewall tab and click update.
Task 5 – Configure DNS Analytics
In this task we will query and configure DNS AVR profile. This will be done using REST API (explored in previous Lab)
Perform the following steps to complete this task:
Click the ‘DNS’ item in the SP Module Postman Collection
Notice that we are sending a GET request to the
/mgmt/tm/ltm/profile/dns-loggingendpoint. Check the body returned and observer the default values.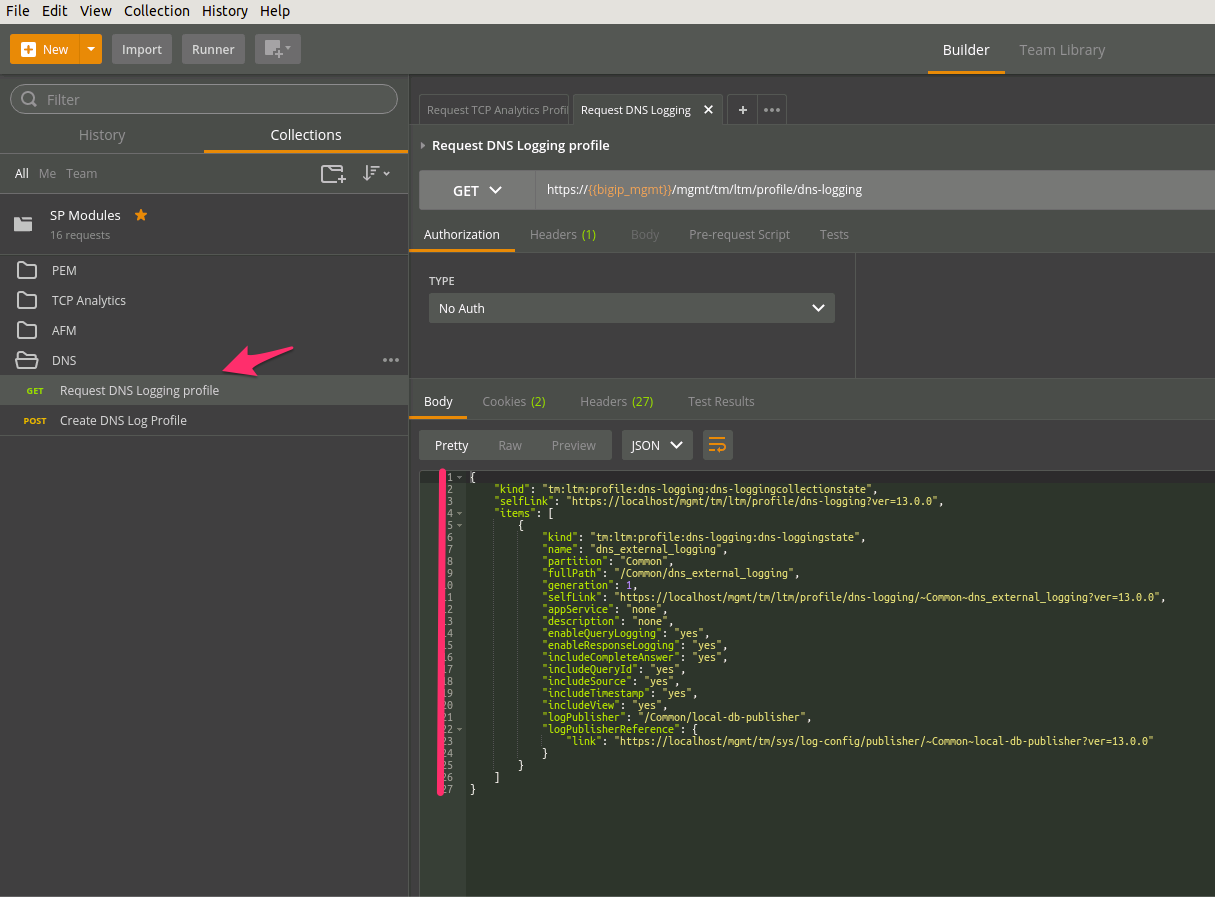
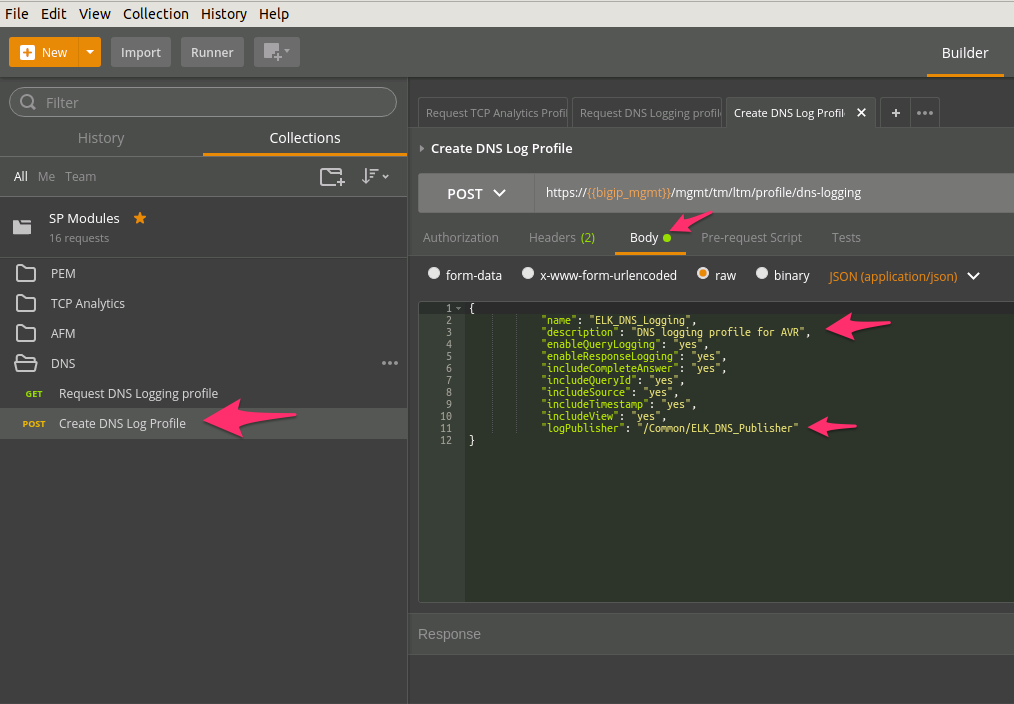
Click on the ‘Create DNS Log Profile’ , check the body message for ELK_DNS_Publisher.
Verify in BIG-IP TMUI that the new profile was created.